- Description
- Specifications
- Documents
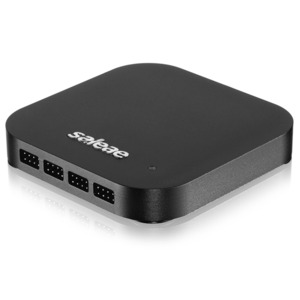
The Saleae Logic Pro 16-B USB Logic Analyzer (Black) is an 16 channel logic analyzer with each input dual purposed for analog data recording. The device connects to a PC over USB and uses the Saleae Logic Software to record and view digital and analog signals.
Logic analyzers are great for debugging embedded applications. In the most common case, a developer working on firmware for a microcontroller will write code to communicate with another component, possibly using protocols like serial, I2C, or SPI. To verify the functionality or to diagnose errors in the firmware, a logic analyzer is connected to the digital IO used for communication and records the activity during testing. The recording is then shown on the display so the user can view the actual behavior of the firmware, and compare that with the expected behavior to narrow down and identity the source of the issue – or verify that the operation is correct.
Applications
- Firmware Debugging
- FPGA Debugging
- Functional Verification
- Performance Profiling
- Reverse Engineering
- Protocol Decoding
- Data Logging
Key Specifications
- Box Color: Black
- Eight Digital Channels
- 500 MSPS Digital Sampling (max)
- 100 MHz Max Digital Bandwidth
- Eight Analog Channels
- 50 MSPS Analog Sampling (max)
- 5 MHz Analog Bandwidth
- Recording Length Limited by Available RAM and Density of Recorded Data
- RGB LED, Customizable 24 bit Color
- USB 3.0 Super Speed
What is a Logic Analyzer?
A logic analyzer is a debugging tool used to record and view digital signals. It operates by sampling a digital input connected to a device under test (DUT) at a high sample rate. These samples are recorded to a sample buffer, and at the end of the capture, the buffer is displayed in the software for review. Logic analyzers are great for debugging embedded applications. They operate by sampling a digital input connected to a device under test (DUT) and then displaying the recording on your computer. This is great for debugging a wide range of embedded problems. For instance, If an I2C device isn’t responding, you can record SDA and SCL to see if the start condition, device address, and ACK/NAK bit frame look right. It’s a huge help for any project with a microcontroller, FPGA or ARM chip.
Easy-to-use Software
The Saleae Logic devices connect to your PC over USB. Navigate your data easily and intuitively with Logic's fluid and fully animated mouse-driven interface. Drag the display with the mouse, zoom with the scroll wheel, even toss the display to find nearby events.
Protocol Decoding
The Saleae products support decoding for over 20 different protocols. This means when you record those SPI messages, or a CAN bus, you won’t need to stare at transitions and clock edges. Instead, Just add the protocol decoder and read the data entire bytes – or even transactions at a time.
Enjoy on Windows, Mac, or Linux.
Record
To record your digital and analog signals, just press start. You can fill your entire computer’s memory with data so it is easy to capture lengthy or rare events.
Setup
Every Logic device can be customized to capture data the way you want. You can select how long to record, specify how bandwidth is allocated between digital and analog recoding, select which channels to record, and even make the LED your favorite color.
Navigate
When you have billions of data points to display, it is important that getting around in all that data is a zippy experience. Effortlessly zoom in and out with the scroll wheel, and navigate left and right by dragging the data where you want it.
Measure
For basic measurements, just place your mouse near something interesting. The software will figure out the rest and display the relevant measurements. You can show different measurements by right-clicking.
Trigger & Find
The software can start recording automatically when it finds a simple pattern you specify. You can trigger on digital edges and pulses as well as analog voltages and pulses. After you collect your data, you can search for more events this way too.
SPI, I2C & more
Most digital communication uses a particular protocol that specifies how information is transferred. The Logic software has protocol analyzers that can automatically decode SPI, I2C, serial, 1-Wire, CAN, UNI/O, I2S/PCM, MP Mode, Manchester, Modbus, DMX-512, Parallel, JTAG, LIN, Atmel SWI, MDIO, SWD, LCD HD44780, BiSS C, HDLC, HDMI CEC, PS/2, USB 1.1, Midi - or create your own with the SDK.
Search
Once you have decoded your data with a protocol analyzer, you can search through all these decoded results by just typing what you are looking for – the software will jump right to the spot where it happened.
Annotate
In the software, you can add unlimited bookmarks, which remember what you were looking at; timing markers, which can measure the time between events; and measurements, which annotate the waveform with parameters like width, frequency, RMS voltage and duty cycle.
Save & Share
Once you’ve annotated your data, you can easily save it for later review. You can even save it in the cloud to send to colleagues or post online!
Export
Sometimes you will need to do something pretty custom with your data, so you’ll be happy to know it is easy to export it in a variety of formats, including a text csv file or Matlab m file.
Automate
If you need to automate the Logic software, you can control everything over a simple TCP socket using virtually any programming language.
SDK
Have a rare or proprietary protocol you would like to have Logic decode? You can with our Analyzer SDK.
